A short intro on this blog series
This is Part 3 of my troubleshooting series for System Center Operations Manager. After covering Windows and Linux/UNIX agents, this article focuses on the most critical server-side role in any management group: the SCOM management server (MS).
If you want to start from the agent side first, here are the previous parts of the series:
- Part 1 – Windows agent
https://pohn.ivanadrobek.com/troubleshooting-system-center-operations-manager-part-1-troubleshooting-the-windows-scom-agent
and
- Part 2 – Linux/UNIX agents
https://pohn.ivanadrobek.com/comprehensive-troubleshooting-guide-for-scom-linux-unix-agents/
A management server is not „just another Windows server“. It hosts core SCOM services, executes monitoring workflows (Microsoft Monitoring Agent service (HealthService) plus MonitoringHost.exe), distributes configuration to agents, provides the SDK connection endpoint for consoles and integrations, and participates in resource pools that provide high availability for the management group.
Scope: SCOM 2019, SCOM 2022, and SCOM 2025. The troubleshooting methodology is the same across these releases; version-specific differences are called out where they matter.
Part 3: Troubleshooting the SCOM Management Server
The goal of this guide is to provide a single end-to-end troubleshooting guide for the SCOM management server that still reads like an article, not just a checklist. It is written to be useful in both small environments (single management server, single SQL server, limited management packs) and enterprise environments (multiple management servers, resource pools, highly available SQL, heavy workflow load). Gateway-specific troubleshooting is intentionally excluded and will be handled in a dedicated follow-up article.
How to use this guide: start with the triage chapter and only then go deeper into the service-, pool-, or SQL-specific sections. In incidents, the main objective of the first 10 minutes is to identify the failing layer (SDK, workflow execution, configuration distribution, resource pool quorum, or SQL). Once you have that, the rest becomes much more predictable.
Table of contents
1. Quick triage: what is broken and where to start
2. Management server role – components and data flows
3. Where to look in the SCOM console (MS and resource pools)
4. Event logs and SCOM logs (what matters most)
5. Core services deep-dive (HealthService, cshost, OMSDK, MonitoringHost)
6. Resource pools troubleshooting (quorum, failover, distribution)
7. Performance troubleshooting (CPU, memory, Event 2115, workflow storms)
8. Workflow-level troubleshooting tools (WFAnalyzer, tracing, support toolset)
9. SQL-based troubleshooting (useful OpsDB/DW queries)
10. Common incident patterns and resolution steps
11. Data collection checklist for escalations
12. References and further reading
1. Quick triage: what is broken and where to start
Before diving into logs or traces, we need to classify the actual issue. In practice, management server problems almost always fall into one of five buckets. The labels below are intentionally broad – the idea is to identify the failing layer first, and only then go deeper.
- A) Console / SDK connectivity: Admins or Operators cannot connect, SDK-based integrations fail, or you see errors like „The OpsMgr SDK Service is not available“.
- B) Monitoring execution: Agents go into a Not Monitored/Unknown state, workflows fail or flap, and MonitoringHost/HealthService load spikes.
- C) Configuration distribution: Management pack or override changes do not apply, Run As profiles do not distribute, new agents never go into a „monitored“ state.
- D) Resource pool and quorum: A pool is degraded, a management server is greyed out, or failover does not behave as expected.
- E) SQL symptoms that surface everywhere: SDK timeouts, delayed alerts/state changes, grooming backlog, or broad latency patterns.
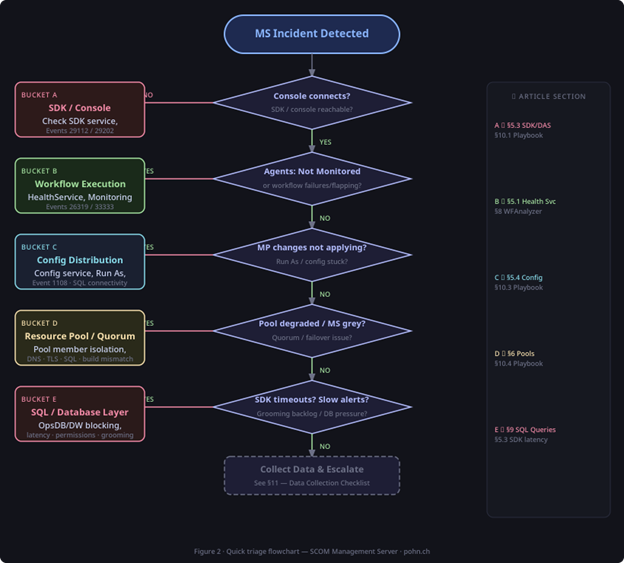
Figure 1: Quick triage flowchart mapping symptoms to the failing layer (Buckets A–E).
1.1 Fast checks (works for small and enterprise environments)
In the middle of an incident you want a repeatable routine that quickly separates local management server problems (services and workflow execution) from pool-level issues and from SQL bottlenecks.
- Test console connectivity and latency (is it global, or only a single workstation?).
On the affected management server, verify the status of all core services: Microsoft Monitoring Agent service (HealthService), System Center Data Access service (OMSDK), and System Center Management Configuration service (cshost).
Open Event Viewer and start with Applications and Services Logs → Operations Manager.
- Check the CPU/RAM utilization and process hotspots (MonitoringHost.exe, HealthService.exe, Microsoft.Mom.Sdk.ServiceHost.exe, cshost.exe).
- If you have multiple management servers: check the resource pool health in the console.
- Validate SQL connectivity from the management server to the Operations DB and Data Warehouse (name resolution, connectivity, login, latency).
PowerShell fast checks (optional)
Get-SCOMManagementServer |Select DisplayName, HealthState
Get-SCOMResourcePool |Select DisplayName, MemberCount, HealthState
Get-SCOMAgent -ManagingManagementServer ‚<MSName>‘ |Where-Object
{$_.HealthState -ne ‚Success‘} |Select DisplayName, HealthState, Version
1.2 Small MG vs enterprise MG: different first suspects
A single-management-server environment and a pool-based enterprise environment fail in most of the cases in different ways. In a small management group, if the management server is unhealthy the whole management group is impacted, so you need to start troubleshooting locally: services, the Operations Manager event log, and SQL connectivity. In an enterprise management group, the first question is usually which pool is degraded and why. Many „MG down“ situations are in fact an SDK pool issue or a broken All Management Servers pool where quorum is not met or a member became isolated for some reason.
2. Management server role – components and data flows
An effective troubleshooting requires an accurate conceptual model of what a management server actually does. At runtime, the HealthService hosts and schedules workflows, while MonitoringHost.exe provides isolation for many of those workflows. On top of that, the server participates in configuration distribution (management packs, overrides, Run As profiles), exposes the SDK/Data Access (OMSDK) endpoint that consoles and integrations rely on, and participates in one or more resource pools to provide high availability for selected workloads.
Under all of this sits SQL connectivity to the Operations DB and Data Warehouse (and optionally ACS). That is why SQL symptoms so often look like „management server“ symptoms.
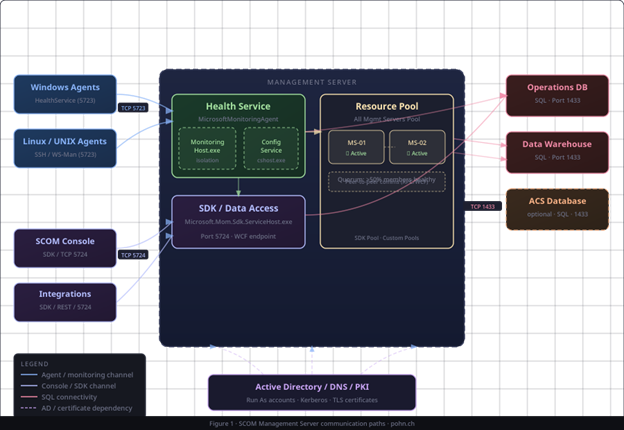
Figure 2: Diagram showing data flows between consoles, management servers, resource pools, SQL, and agents.
2.1 Required TCP ports and connectivity quick reference
When a management server issue smells like „random timeouts“, it is often a simple connectivity problem. The list below is deliberately short and focuses on what matters most for management server troubleshooting.
TCP 5723 – Agent → management server (HealthService channel).
TCP 5724 – Console / SDK clients → management server (System Center Data Access (OMSDK) endpoint).
TCP 1433 – Management server → SQL instance hosting OperationsManager (OpsDB) and OperationsManagerDW (DW).
- UDP 1434 (optional) – SQL Browser for named instances (only if you rely on it).
- TCP 443 (situational) – Certificate chain validation (CRL/OCSP), connected features, proxies, and some integrations.
Regarding gateways: if you use gateways, expect additional TCP 5723 communication from gateways to management servers as part of the same HealthService channel. I intentionally do not cover gateway-specific failure modes here as there will be a dedicated gateway article, which will focus on those scenarios.
Tip: evidence-driven connectivity checks
Test-NetConnection -ComputerName <MSName> -Port 5724 (from a console host)
Test-NetConnection -ComputerName <SQLNameOrListener> -Port 1433 (from the management server)
Test-NetConnection -ComputerName <MSName> -Port 5723 (from an affected agent)
3. Where to look in the SCOM console (MS and resource pools)
The console is often the fastest way to identify the failing layer. These views typically answer the question „is this a single server problem, a pool problem, or a SQL problem?“
- Monitoring → Operations Manager → Management Servers (health, alerts, state changes)
- Monitoring → Operations Manager → Resource Pools (quorum, pool member health)
- Monitoring → Operations Manager → Agent Health State (useful when the issue is widespread)
- Administration → Device Management → Management Servers (configuration and properties)
- Administration → Run As Configuration (profiles, distribution, Run As accounts)
- Administration → Management Packs (recent imports/changes, version mismatches)
3.1 Health Explorer and the „what changed?“ approach
For a specific management server object, the SCOM Health Explorer is usually the fastest path to the likely root-cause candidate. Identify the monitor that flipped the state, correlate the timestamp with recent changes, and then work backwards: management pack imports, overrides, Update Rollups, TLS hardening, SQL maintenance, or SQL failovers.
4. Event logs and SCOM logs (what matters most)
4.1 Event logs on a management server
Start with the Operations Manager log under Applications and Services Logs – it is where SCOM components are most talkative by default. From there, check the Application log for service crashes and .NET runtime failures, and the System log for service control manager events, networking, TLS (Schannel), and time synchronization issues.
- Applications and Services Logs → Operations Manager
- Windows Logs → Application (service crashes, .NET runtime, SQL client errors)
- Windows Logs → System (service control manager, networking, TLS, time sync)
4.2 Highly relevant events (quick mapping)
During troubleshooting, recurring events could quickly points to the failing layer. For example, Events 29112 / 29202 strongly indicate SDK / data access problems, Events 26319 / 33333 usually accompany workflow and module failures, Event 1108 points to Run As distribution problems, Events 21024 / 21025 / 21026 are useful for configuration churn diagnostics, and Event 2115 is a classic symptom of workflow overload.
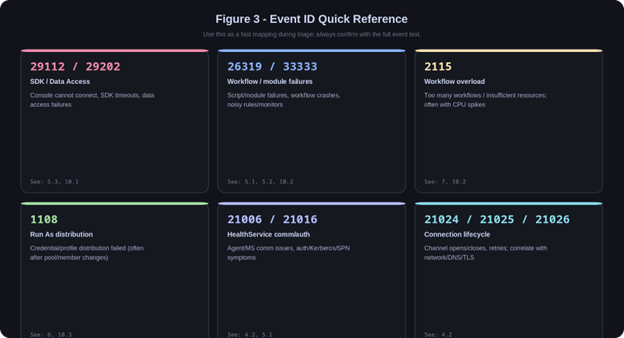
Figure 3: Key Operations Manager event IDs (quick mapping to issue categories and sub-categories).
4.3 SCOM log folders that matter
Besides event logs, a few folders are worth memorizing because they could help you shorten troubleshooting time dramatically. They contain HealthService logging, optional tracing output, and setup artifacts that often explain why a change did not apply as expected.
- HealthService logs: %ProgramFiles%\Microsoft Monitoring Agent\Agent\Logs
- OpsMgr trace logs (when enabled or when auto-tracing is active): C:\Windows\Logs\OpsMgrTrace
- Temporary deployment and setup logs: %TEMP% and %ProgramData%\Microsoft\System Center\Operations Manager
- IIS logs (only if you host web components on the management server): %SystemDrive%\inetpub\logs\LogFiles
5. Core services deep-dive (HealthService, Config, SDK/DAS, MonitoringHost)
In the sections below, I treat the management server as both a Windows server and a SCOM application role. The goal is to connect observable symptoms (console outages, workflow failures, distribution problems) to the responsible service or process (HealthService, MonitoringHost.exe, OMSDK, cshost), and then to the dependency that is often the real cause (SQL latency or blocking, authentication and name resolution, or mismatched builds after patching).
5.1 Microsoft Monitoring Agent service (HealthService)
The HealthService (Microsoft Monitoring Agent) is the core processing engine of a management server. When it is the primary issue, you usually see delayed state changes, sustained CPU or memory pressure, an unusual number of MonitoringHost.exe instances, and recurring Events 26319/33333 in the Operations Manager log. Start by confirming whether the Microsoft Monitoring Agent service (HealthService) is running, then look at HealthService.exe and MonitoringHost.exe for abnormal resource use, and finally review the agent logs for queue, configuration, or module-level hints.
HealthService cache reset (use when configuration or workflow state is clearly stuck)
Stop-Service HealthService
Remove-Item -Path „$env:ProgramData\Microsoft\Microsoft Monitoring Agent\Agent\Health Service State“ -Recurse -Force
Start-Service HealthService
Notes: Expect reconfiguration and a temporary spike in load. In pool environments, do this one management server at a time and validate pool health after each step.
5.2 MonitoringHost.exe – workflow isolation and storms
SCOM isolates many workflows into MonitoringHost.exe instances. This improves stability, but a single noisy or mistargeted workflow can create a MonitoringHost storm that consumes CPU/RAM and makes the server look broken. Restarting HealthService is a temporary mitigation but rarely addresses the root cause. A practical approach is to identify the affcected MonitoringHost.exe instance, map it back to the responsible workflow(s) using WFAnalyzer or tracing, and then tune the management pack or overrides (frequency, targeting, script timeouts) until the load returns to a sustainable level.
5.3 System Center Data Access service (OMSDK) – console and integrations
If admins or operators cannot connect to the console or the console becomes extremely slow, treat it as an SDK layer problem until proven otherwise. First confirm the System Center Data Access service (OMSDK) is running and check for Events 29112 and 29202 in the Operations Manager log. Afterwards validate SQL connectivity and latency to the Operations DB – many SDK outages are simply SQL blocking or SQL latency. In enterprise environments, check the SDK-related resource pool health and quorum as part of the first pass. Typical root causes include SQL blocking, service account permission changes, authentication failures, and post-update build mismatches between management servers.
5.3.1 Authentication, service accounts, and Kerberos/SPN checks
In practice, many “SDK is down” issues are not service crashes but authentication or permission type of complications. Keep this as a fast checklist (evidence-driven, no deep AD dive):
- Confirm which account the System Center Data Access service (OMSDK) runs under, and whether it changed recently (service properties, GPO changes, password rotation, etc.).
- SQL permissions: verify the OMSDK account still has the expected rights on the Operations DB (and DW if applicable). If this broke after a change, you will often see Events 29112 / 29202.
- Kerberos/SPN: if consoles use Kerberos to talk to the SDK, verify MSOMSDKSvc SPNs are still registered on the OMSDK service account (common failure after account changes).
- Time sync and DNS: Kerberos is sensitive to clock skew and name resolution. Correlate with System log events and recent DNS changes.
5.4 System Center Management Configuration service (cshost) – configuration distribution
Configuration distribution problems show up as new agents not receiving configuration, management pack changes not applying, Run As profiles not distributing, or health states remaining stale after changes. In most cases, the fastest path is to confirm the System Center Management Configuration service (cshost) is running is to review the Operations Manager log for distribution errors, and validate basic SQL connectivity (distribution is database-driven). In multi-management-server environments, also confirm the affected management server is still participating correctly in the All Management Servers resource pool.
5.4.1 Decision box: churn vs stale configuration
Configuration problems typically fall into one of two patterns. Deciding which one you have will save a lot of time:
| Churn (constant recalculation) | Stale config (changes not updating) |
|---|---|
| Symptoms: frequent config-related events, persistent recalculation, and agents never settle. Often correlated with frequent discovery/property changes. | Symptoms: overrides/MP changes do not apply, new agents stay “Not Monitored”, and expected state changes never appear. |
| Where to look first: Operations Manager log patterns around Events 21024/21025/21026 and the churn guidance (frequent configuration changes). | Where to look first: the Microsoft “configuration data isn’t updated” guidance (classic symptom set + remediation steps). |
References: configuration churn guidance (frequent configuration changes) and stale configuration guidance (configuration data isn’t updated).
- Churn: https://learn.microsoft.com/en-us/troubleshoot/system-center/scom/detect-troubleshoot-configuration-changes
- Stale config: https://learn.microsoft.com/en-us/troubleshoot/system-center/scom/configuration-data-not-updated
5.4.2 Authentication and identity dependencies (what to check)
When configuration distribution breaks after an infrastructure change, the root cause is often identity-related rather than ‚SCOM logic‘. Keep the checks lightweight and evidence-driven:
- AD/DNS: confirm the management server computer account has a healthy domain secure channel (nltest /sc_verify) and can resolve domain controllers and peer management servers.
- Kerberos: look for Kerberos/LSA errors in the System/Application logs around the issue time window; validate time synchronization and DNS.
- Run As distribution: Event 1108 often correlates with password rotation, GPO hardening, or pool membership changes. Verify distribution targets and profiles first, then validate AD reachability.
- Certificate chain reachability: if policies enforce stricter TLS, make sure CRL/OCSP endpoints are reachable from the management server (proxy/firewall).
5.5 TLS and certificate hardening (where it breaks management servers)
TLS changes rarely break SCOM – they usually show up as timeouts and authentication problems across multiple layers. On management servers, the most common impact points are SQL connectivity (encrypted connections, protocol/cipher mismatches), certificate chain validation delays (CRL/OCSP reachability), and integrations that rely on HTTPS. Gateway and workgroup certificate scenarios exist too, but those will be handled in the dedicated gateway article.
Practical TLS/certificate checks on a management server
System event log: look for Schannel errors around the incident time window.
Name resolution and reachability: validate SQL name/listener resolution and that port 1433 is reachable from the management server.
Certificate chain health: confirm the server can reach CRL/OCSP endpoints for relevant certificates (proxy and firewall matter).
SQL encryption evidence (read-only): in SQL, check sys.dm_exec_connections for encrypt_option = TRUE for SCOM connections if encryption is enforced.
Example: SQL session encryption evidence (run on the SQL instance)
— SQL (read-only): confirm whether the current session is using encryption
— Interpretation: encrypt_option = TRUE means the connection is encrypted. If encryption is required
— by policy, verify that SCOM-related sessions also show TRUE (and investigate failures/timeouts if not).
SELECT session_id, encrypt_option, auth_scheme
FROM sys.dm_exec_connections
WHERE session_id = @@SPID;
6. Resource pools troubleshooting (quorum, failover, distribution)
Resource pools provide high availability for selected workloads and, in most environments, the pool members are management servers. What matters operationally is the quorum. A pool can contain healthy members and still be effectively degraded if a quorum is not met or if members cannot reliably communicate with each other and with SQL.
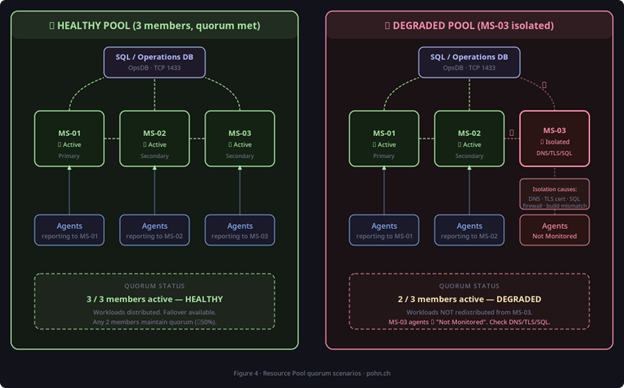
Figure 4: Resource pool quorum scenarios (healthy vs degraded due to member isolation).
6.1 Common pool-related issue patterns
- A management server was removed from the All Management Servers pool → Run As distribution breaks → Event 1108 appears → workflows fail.
- One management server is isolated (DNS, SQL connectivity, authentication) → pool flips degraded → failover behaves unpredictably.
- Pool members look healthy, but the pool is still degraded → often indicates member-to-member communication issues or database timeouts.
- After patching, one management server is on a different build → pool instability and subtle failures.
6.2 Safe operational rules for pools
In a single-management-server design you do not have failover, but pool health still matters because SCOM relies on the All Management Servers pool for internal workflows. In multi-management-server designs, pool hygiene becomes operational discipline. The rules below prevent many self-inflicted outages.
- Never remove a management server from the All Management Servers pool unless you fully understand the consequences (Run As distribution is the classic trap).
- Patch management servers in a controlled sequence and validate pool health after each step.
- Keep pool members homogeneous: same Update Rollup/build, same TLS policy, same hardening baseline.
- Treat pool health as a core dependency, similar to SQL health.
6.3 Verify SCOM build and Update Rollup alignment
Build mismatches are a frequent cause of pool instability after patching. In enterprise environments, verify that all management servers are on the same build before you chase deeper ghosts.
Update Rollup / build mismatch troubleshooting flow (5-step)
Use this checklist when pool behavior is inconsistent after patching or when only some consoles/operators see issues:
- Confirm the management server versions in the console: Administration → Operations Manager Products → Management Servers (Version column).
- Confirm the file versions on at least one affected management server (for example Microsoft.Mom.Sdk.ServiceHost.exe and Microsoft.Mom.Common.dll) and compare between servers.
- Confirm all management servers are aligned on the same UR/build. If they are not, stop and align before doing deeper troubleshooting.
- Confirm console versions are aligned with the management server UR (outdated consoles are a common source of misleading symptoms).
- Validate pool health after each patch step: Monitoring → Operations Manager → Resource Pools (quorum and member state).
Build/UR checks (fast)
Console: Administration → Operations Manager Products → Management Servers (Version column).
Registry (common pattern): HKLM\SOFTWARE\Microsoft\System Center Operations Manager\12\Setup\Server → „RTM_UR Version“.
Files: check the file version of Microsoft.Mom.Sdk.ServiceHost.exe (SDK) and Microsoft.Mom.Common.dll (server components).
Mapping: compare your build number with the official Microsoft build version list.
7. Performance troubleshooting (CPU, memory, Event 2115, workflow storms)
Performance issues are frequently reported as „SCOM is broken“, but the root cause is often capacity or workload. Typical symptoms include a sluggish console, delayed alerts and state changes, high CPU on MonitoringHost.exe or HealthService.exe, memory pressure and paging, and Event 2115 indicating overload. The goal is to separate systemic problems (SQL latency, global workflow noise) from a single-server hotspot, and then reduce or isolate the heaviest workflows before scaling decisions.
7.0 Quick baselines (rule of thumb)
These are not hard limits. They are starting points that help you decide whether you are looking at normal background noise or a real overload condition:
| Signal | Rule of thumb interpretation |
|---|---|
| MonitoringHost.exe instance count | Typically low double-digits per management server. Sustained high counts (for example >20) together with CPU pressure usually indicate a workflow storm or runaway isolation. |
| CPU utilisation | Short spikes are normal. Sustained >70% on MonitoringHost.exe/HealthService.exe for many minutes is a strong signal to identify the heavy workflows (WFAnalyzer / tracing). |
| Event 2115 frequency | Occasional events may happen during bursts. Repeated 2115 events during normal operation indicate backpressure (workflow storm and/or SQL bottleneck). |
| Console latency | If the console becomes slow across multiple operator machines, treat it as an SDK/SQL symptom first (Events 29112/29202 + SQL blocking). |
7.1 A practical performance troubleshooting routine
When having performance issues, avoid the instinctive reaction of restarting services. Restarting can temporarily reduce symptoms, but it does not tell you why the management server was under pressure. A short routine that always answers two questions is more effective: which process is consuming resources, and which workflow or dependency is driving that load.
- Identify the hotspot process: MonitoringHost.exe, HealthService.exe, SDK host (Microsoft.Mom.Sdk.ServiceHost.exe), or general OS pressure.
- Correlate the timestamp with recent management pack imports or override changes.
- Decide whether the issue is isolated to one management server or affects all management servers.
- If MonitoringHost is the hotspot: use WFAnalyzer/tracing to identify the heavy workflows/modules.
- If SDK is the hotspot: validate OpsDB performance (blocking, long-running queries, maintenance window overlap).
- Apply targeted tuning: reduce frequency, narrow scope, temporarily disable the noisiest rules with a rollback plan.
7.2 Scale up vs scale out
In a small management group, scaling up is often the pragmatic option: add CPU/RAM, ensure fast storage, and establish a solid SQL baseline. In enterprise management groups, scaling out by adding more management servers to the relevant pools can be the right move, but only after you reduce workflow noise. Otherwise you simply spread the same storm across more hosts.
8. Workflow-level troubleshooting tools (WFAnalyzer, tracing, support toolset)
8.1 Workflow Analyzer (WFAnalyzer)
WFAnalyzer is valuable when the Operations Manager log tells you that workflows are failing or noisy, but not which workflows are doing the damage. Use it to identify CPU-heavy workflows, very frequent „chatter“, and module failures that correlate with Events 26319 / 33333.
WFAnalyzer – how to use it during an incident
1) Run WFAnalyzer on the affected management server (or on a box with access to the generated logs).
2) Sort by CPU and instance count to find the top offenders.
3) Capture the workflow GUID(s) and the module name; correlate the time window with Event 26319/33333.
4) Map the workflow back to a rule/monitor (via console search or management pack review) and validate targeting and frequency.
5) Apply a targeted override (frequency/timeout/target narrowing) and re-check CPU + MonitoringHost instance counts.
WFAnalyzer is included in the Microsoft „Management Pack Tools“ download. The v2 release matters because it adds better historical analysis (including richer traces and visual CPU/memory trends) and makes it easier to export evidence for deeper investigations.
8.2 Diagnostic tracing (OpsMgrTrace / ETL)
Diagnostic tracing becomes useful when standard event logs are not enough, when you need to correlate internal timing and module behavior, or when you need a defensible evidence pack for deeper analysis. Keep tracing windows short and purposeful; it is noisy by design.
Start/stop tracing (classic tools)
Tools location: the installed role contains a Tools folder with StartTracing.cmd and StopTracing.cmd.
Default output: C:\Windows\Logs\OpsMgrTrace (ETL files; by default error-level only).
Start tracing (verbose): StartTracing.cmd VER
Stop tracing: StopTracing.cmd
Convert ETL to text: FormatTracing.cmd (writes .log files next to the .etl files).
Capture window: 5-10 minutes around the incident time window. Validate free disk space first.
8.2.1 Tracing safety boundaries (when NOT to trace)
Diagnostic tracing is intentionally verbose. Use it only with a clear goal and a defined time window; otherwise you can create large trace volumes and introduce additional load.
- Do not enable verbose tracing as a default setting in production. Treat it as a short-lived diagnostic tool.
- Validate free disk space before you start, and keep the capture window small (typically 5–10 minutes).
- Stop tracing immediately after reproducing/observing the symptom and convert only the needed window.
- If you are troubleshooting a pure performance incident, start with WFAnalyzer, event logs, and SQL evidence first; tracing is usually the last step.
- Microsoft explicitly recommends tracing primarily in coordination with support because trace conversion/interpretation can be non-trivial.
Example: tracing command sequence (run from an elevated CMD)
cd „C:\Program Files\Microsoft System Center\Operations Manager\Tools“
StopTracing.cmd
StartTracing.cmd VER
REM reproduce the issue
StopTracing.cmd
9. SQL-based troubleshooting (useful OpsDB/DW queries)
SQL is the backbone of SCOM, so many management server symptoms are really OpsDB/DW symptoms: performance, blocking, permissions, connectivity, or maintenance overlap. Start with read-only queries, document what you run, and correlate findings with the SQL maintenance cadence (AG failovers, backups, index maintenance).
Safety note
Run troubleshooting queries as read-only. Avoid ad-hoc maintenance actions during an incident unless you have an agreed SQL change process.
Collected outputs can contain sensitive object names; treat exports and traces accordingly.
9.1 OpsDB sanity queries (read-only)
— Basic environment pulse (read-only)
— Expected: DatabaseName should be OperationsManager when run in the OpsDB context.
SELECT @@SERVERNAME AS ServerName, DB_NAME() AS DatabaseName, SYSDATETIME() AS NowLocal;
— Recent alerts (quick pulse)
— Expected: should return newly created alerts. If alerts stop arriving during an incident,
— investigate workflow execution (Events 26319/33333/2115) and SQL backpressure/blocking.
SELECT TOP (50)
TimeGenerated, Severity, Priority, ResolutionState, Name
FROM Alert.vAlert
ORDER BY TimeGenerated DESC;
9.2 Issue essentials: blocking and long-running requests
— Active blockers and blocked sessions (read-only)
— Interpretation: any non-zero blocking_session_id indicates real blocking. Focus on the blocker session
— and its host/program_name to decide whether the blocker is SCOM-related or an external workload.
SELECT
r.session_id, r.blocking_session_id,
r.status, r.command,
r.wait_type, r.wait_time, r.wait_resource,
DB_NAME(r.database_id) AS DatabaseName,
s.login_name, s.host_name, s.program_name,
DATEDIFF(SECOND, s.last_request_start_time, SYSDATETIME()) AS SecondsRunning
FROM sys.dm_exec_requests r
JOIN sys.dm_exec_sessions s ON r.session_id = s.session_id
WHERE r.blocking_session_id <> 0
ORDER BY r.wait_time DESC;
— Long-running requests (tunable threshold)
— Default here is 60 seconds. Increase/decrease depending on your normal baseline and incident severity.
SELECT
r.session_id, r.status, r.command,
DB_NAME(r.database_id) AS DatabaseName,
r.cpu_time, r.total_elapsed_time,
s.login_name, s.host_name, s.program_name
FROM sys.dm_exec_requests r
JOIN sys.dm_exec_sessions s ON r.session_id = s.session_id
WHERE r.total_elapsed_time > 60000
ORDER BY r.total_elapsed_time DESC;
9.3 Grooming backlog indicators (OpsDB)
— Grooming/partitioning queue size (read-only)
— Interpretation: if QueueItems grows continuously and doesn’t drain, grooming/partitioning is behind.
— This often correlates with general OpsDB pressure (blocking, slow disks, maintenance overlap).
SELECT COUNT(*) AS QueueItems
FROM dbo.PartitioningAndGroomingQueue;
— Recent internal job history (read-only)
— Interpretation: look for repeated failures, unusually long durations, or jobs that stopped running.
SELECT TOP (50)
JobName, Status, LastRunTime, DurationSeconds
FROM dbo.InternalJobHistory
ORDER BY LastRunTime DESC;
9.4 Configuration churn (concept + where to look)
Configuration churn is one of the classic ways an enterprise management group becomes unstable: the System Center Management Configuration service (cshost) constantly recalculates configurations and agents never settle. The most practical starting point is the Operations Manager log pattern: long strings of Event 21024 without a corresponding Event 21025 or Event 21026. If you have Reporting installed, Data Warehouse queries can help identify discovery workflows that submit frequent changes.
9.5 PowerShell alternatives (when you cannot query SQL directly)
If you do not have direct access to SQL, you can still collect useful evidence from the SCOM PowerShell module. These are not replacements for blocking/grooming diagnostics, but they help validate symptoms quickly:
Import-Module OperationsManager
# Recent alerts (similar to the ‚Recent alerts‘ SQL pulse)
Get-SCOMAlert | Sort-Object TimeRaised -Descending | Select-Object -First 50 TimeRaised, Severity, ResolutionState, Name
# Management servers and versions (build mismatch evidence)
Get-SCOMManagementServer | Select-Object DisplayName, Version, HealthState
# Resource pools and health (quorum symptoms)
Get-SCOMResourcePool | Select-Object DisplayName, MemberCount, HealthState
10. Common incident patterns and resolution steps
10.1 Console cannot connect (SDK down / pool down)
If the console cannot connect, focus first on the SDK layer. Typical indicators are the console error itself and Events 29112 / 29202 in the Operations Manager log. Confirm the OMSDK service is running, validate OpsDB connectivity and latency, and in multi-management-server designs check SDK-related pool health and quorum. Then correlate with recent changes: TLS hardening, service account changes, or patch/build mismatches. For authentication/permission checks, see §5.3.1. For SQL evidence during an outage, see §9.2.
10.2 High CPU by MonitoringHost.exe (workflow storm)
If a management server suddenly runs at very high CPU with many MonitoringHost.exe instances, assume a workflow storm until proven otherwise. You will often see Event 2115 and frequent Events 26319 / 33333 around the same time. Use WFAnalyzer or tracing to identify heavy workflows, correlate timing with recent MP imports/override changes, and reduce or disable the noisiest workflows with a clear rollback plan. After noise is reduced, scale-out decisions become meaningful. See §8.1 for WFAnalyzer steps and §8.2 for tracing guidance.
10.3 Configuration distribution stuck / Run As distribution failures
If configuration or Run As distribution stalls, the symptoms are usually obvious: changes do not apply, Event 1108 appears, and new agents never settle because they do not receive consistent configuration. Start by confirming the management server remains a healthy member of the All Management Servers pool. Then validate Run As distribution settings and security, and correlate distribution errors with SQL connectivity and AD authentication signals. See §5.4.1 for the churn vs stale configuration decision box and §10.3 for Run As distribution diagnostics.
Run As distribution: concrete diagnostics
Console: Administration → Run As Configuration → Accounts / Profiles (verify target distribution).
Look for Event 1108 on management servers after pool membership changes or account password changes.
Validate that the target management server is reachable and healthy (HealthService + SQL connectivity).
Confirm the Run As account password is current and that the account is allowed for the profile and target class.
10.4 Management server greyed out / not participating in a pool
If a management server is greyed out or a pool flips degraded without an obvious service outage, suspect isolation. Work through the layers: confirm local HealthService and OS health, validate connectivity to SQL, and then validate member-to-member communications (name resolution, authentication, firewalls). In enterprise environments, verify all management servers are aligned on the same build level. Cross-reference: see Figure 4 and §6 for quorum context, §2.1 for ports/connectivity checks, and §6.3 for build alignment.
10.4.1 Management server turns gray: canonical isolation patterns
This is one of the most common (and most searched) SCOM issues. “Gray” is usually not a single bug – it is SCOM telling you that the management server is effectively isolated from the management group runtime (peers, pool, or SQL).
Typical symptoms:
- The management server object shows as grayed out/unavailable in Monitoring → Operations Manager → Management Servers.
- One or more resource pools flip to degraded (quorum not met or member is unreachable).
- Agents primarily managed by the isolated server drift to “Not Monitored” or show delayed state changes.
Where to look first (fast):
- Resource Pools view: which pool is degraded, and which member(s) are missing?
- Operations Manager event log on the affected management server: focus on connectivity/authentication patterns and any SQL client or Schannel errors in System/Application logs.
- Connectivity evidence: DNS resolution between management servers, SQL listener resolution, and port reachability (TCP 1433 to SQL, TCP 5723/5724 where applicable).
What it usually is (common root-cause buckets):
- Name resolution issues (DNS) between management servers or to SQL (especially after changes or split DNS).
- Authentication/TLS mismatch after hardening (Schannel errors, certificate chain/CRL reachability issues).
- SQL connectivity or latency (blocking, AG failover side effects, login failures).
- Update Rollup/build mismatch between pool members (post-patching instability).
- All Management Servers pool membership problems (removal from the pool is a classic trigger).
Microsoft references:
- Management server turns gray after removal from All Management Servers pool: https://learn.microsoft.com/en-us/troubleshoot/system-center/scom/management-server-turns-gray
- Troubleshoot gray agent states (covers agents, management servers, and gateways): https://learn.microsoft.com/en-us/troubleshoot/system-center/scom/troubleshoot-gray-agent-states
Safe restart sequence (pool-aware)
1) Validate quorum and pick one management server at a time (enterprise).
2) Stop OMSDK (System Center Data Access) if you need to reset SDK symptoms.
3) Stop HealthService (Microsoft Monitoring Agent).
4) If required: perform HealthService cache reset (section 5.1).
5) Start HealthService, wait for stabilization.
6) Start OMSDK, validate console connectivity and event logs.
11. Data collection checklist for escalations
When you escalate to a senior engineer or Microsoft support, the goal is to provide a complete, time-aligned evidence pack. The list below is structured to be fast to collect and easy to consume.
Always capture first
Exact incident time window (start/end) and which management servers are affected.
Whether the issue is isolated to one management server, one pool, or the whole management group.
Recent changes: Update Rollups, TLS hardening, management pack imports, SQL maintenance/failover.
11.1 Export the relevant event logs
Example: export event logs (run elevated on the affected management server)
wevtutil epl „Operations Manager“ „C:\Temp\OpsMgr_OperationsManager.evtx“ /ow:true
wevtutil epl „Application“ „C:\Temp\OpsMgr_Application.evtx“ /ow:true
wevtutil epl „System“ „C:\Temp\OpsMgr_System.evtx“ /ow:true
11.2 Collect logs and traces
- %ProgramFiles%\Microsoft Monitoring Agent\Agent\Logs (HealthService logs)
- C:\Windows\Logs\OpsMgrTrace (ETL and converted .log files if tracing was enabled)
- %ProgramData%\Microsoft\System Center\Operations Manager (setup/config artifacts)
11.3 Collect build/pool evidence
- Screenshot: Monitoring → Operations Manager → Management Servers (health states).
- Screenshot: Monitoring → Operations Manager → Resource Pools (member health and quorum).
- Export: Administration → Operations Manager Products → Management Servers (versions/builds).
11.4 SQL evidence bundle (read-only outputs)
Capture the output of the following categories of queries from the SQL instance hosting OpsDB and, if relevant, the DW:
- Blocking and long-running requests (section 9.2).
- Grooming/backlog indicators (section 9.3).
- Database size and free space (your standard DBA query set).
12. References and further reading
These are the references I most often use when troubleshooting management server-side issues:
- Part 1 – Troubleshooting the Windows SCOM Agent (series context):
https://pohn.ivanadrobek.com/troubleshooting-system-center-operations-manager-part-1-troubleshooting-the-windows-scom-agent/ - Part 2 – Linux/UNIX agents troubleshooting guide (series context):
https://pohn.ivanadrobek.com/comprehensive-troubleshooting-guide-for-scom-linux-unix-agents/ - SCOM resource pool design (concepts, quorum, recommended design patterns):
https://learn.microsoft.com/system-center/scom/plan-resource-pool-design?view=sc-om-2025 - Configure a firewall for Operations Manager (ports and directions):
https://learn.microsoft.com/system-center/scom/plan-security-config-firewall?view=sc-om-2025 - Agent planning and communication (agent to management server port 5723):
https://learn.microsoft.com/system-center/scom/plan-planning-agent-deployment?view=sc-om-2025 - Use diagnostic tracing in Operations Manager (StartTracing/StopTracing, OpsMgrTrace details): https://learn.microsoft.com/troubleshoot/system-center/scom/use-diagnostic-tracing
- Detect and troubleshoot frequent configuration changes (churn patterns, Events 21024/21025, DW approach): https://learn.microsoft.com/troubleshoot/system-center/scom/detect-troubleshoot-configuration-changes
- Configuration data isn’t updated (stale config symptoms and remediation):
https://learn.microsoft.com/en-us/troubleshoot/system-center/scom/configuration-data-not-updated - A management server becomes gray (classic pool membership/isolation pattern):
https://learn.microsoft.com/en-us/troubleshoot/system-center/scom/management-server-turns-gray - Troubleshoot gray agent states (agents, management servers, gateways):
https://learn.microsoft.com/en-us/troubleshoot/system-center/scom/troubleshoot-gray-agent-states - Move the OperationsManager database (service names and stop/start order for core services):
https://learn.microsoft.com/system-center/scom/manage-move-opsdb?view=sc-om-2025 - System Center Operations Manager build versions (map build numbers to releases and URs):
https://learn.microsoft.com/system-center/scom/release-build-versions?view=sc-om-2025 - WFAnalyzer download (workflow analysis tool):
https://www.microsoft.com/en-us/download/details.aspx?id=102671 - WFAnalyzer v2 announcement (what changed and why it matters):
https://techcommunity.microsoft.com/blog/systemcenterblog/workflow-analyzer-v2-release/3536689 - SCOM SQL query library (community reference):
https://kevinholman.com/2016/11/11/scom-sql-queries/